Maintenance KPI Management System
Connect maintenance from failure records to recurrence prevention
A system that records failures and stoppages in manufacturing equipment, normalizes inconsistent wording with an LLM, and connects maintenance KPI visibility with improvement-task tracking. It also retrieves stoppage events from PLCs, searches similar past cases, and supports access control and audit logs, connecting frontline records to recurrence prevention.
View service overview slidesUpdated: 9/2026
The video is in Japanese.
Key Features
Support the maintenance cycle from stoppage records to KPI analysis, improvement tasks, and administration across seven core business screens.
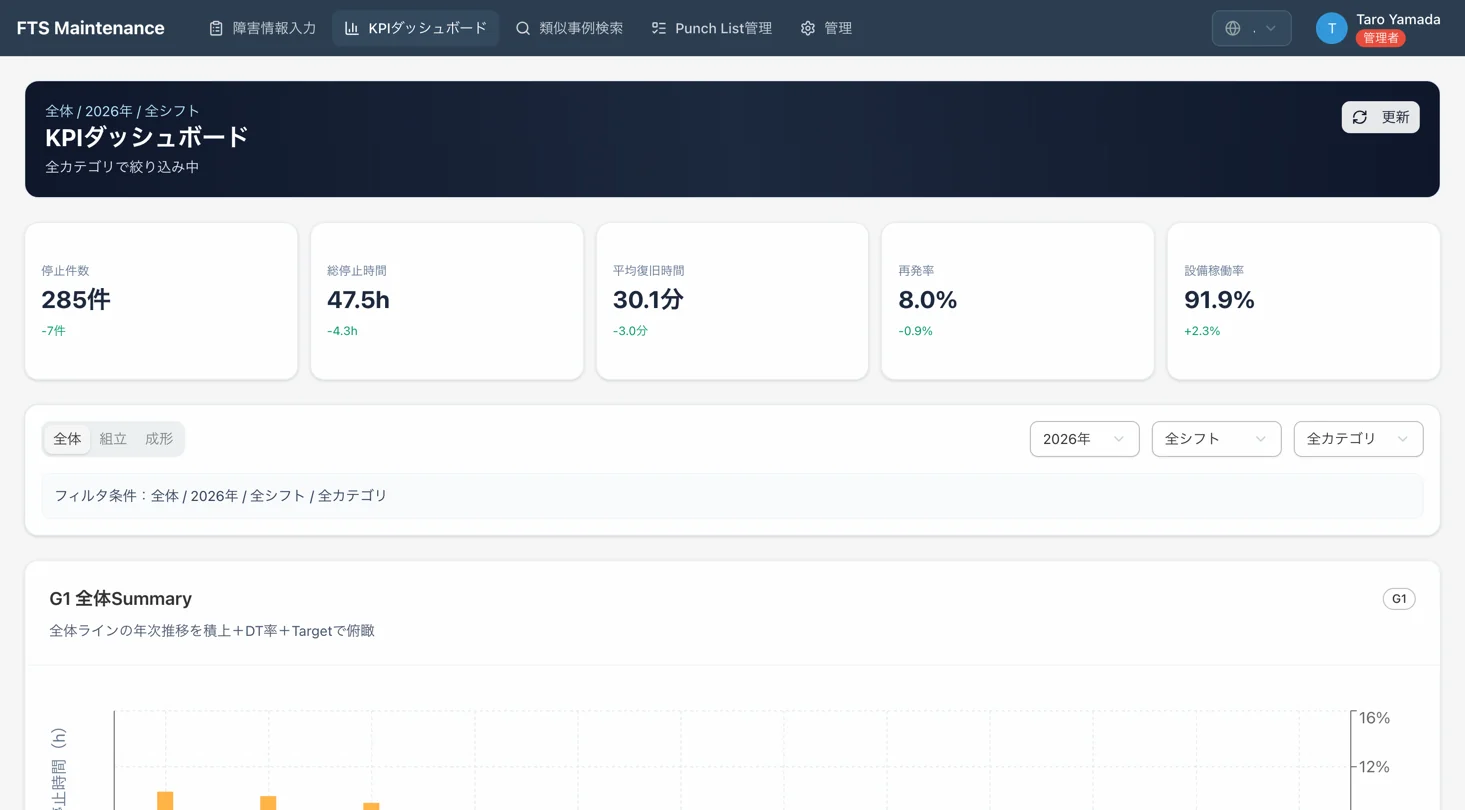
See five maintenance KPIs on one screen
Display stoppage count, total downtime, mean time to repair, recurrence rate, and equipment utilization as metric cards. Switch line groups, fiscal year, shift, and phenomenon category to review KPIs for the desired scope.
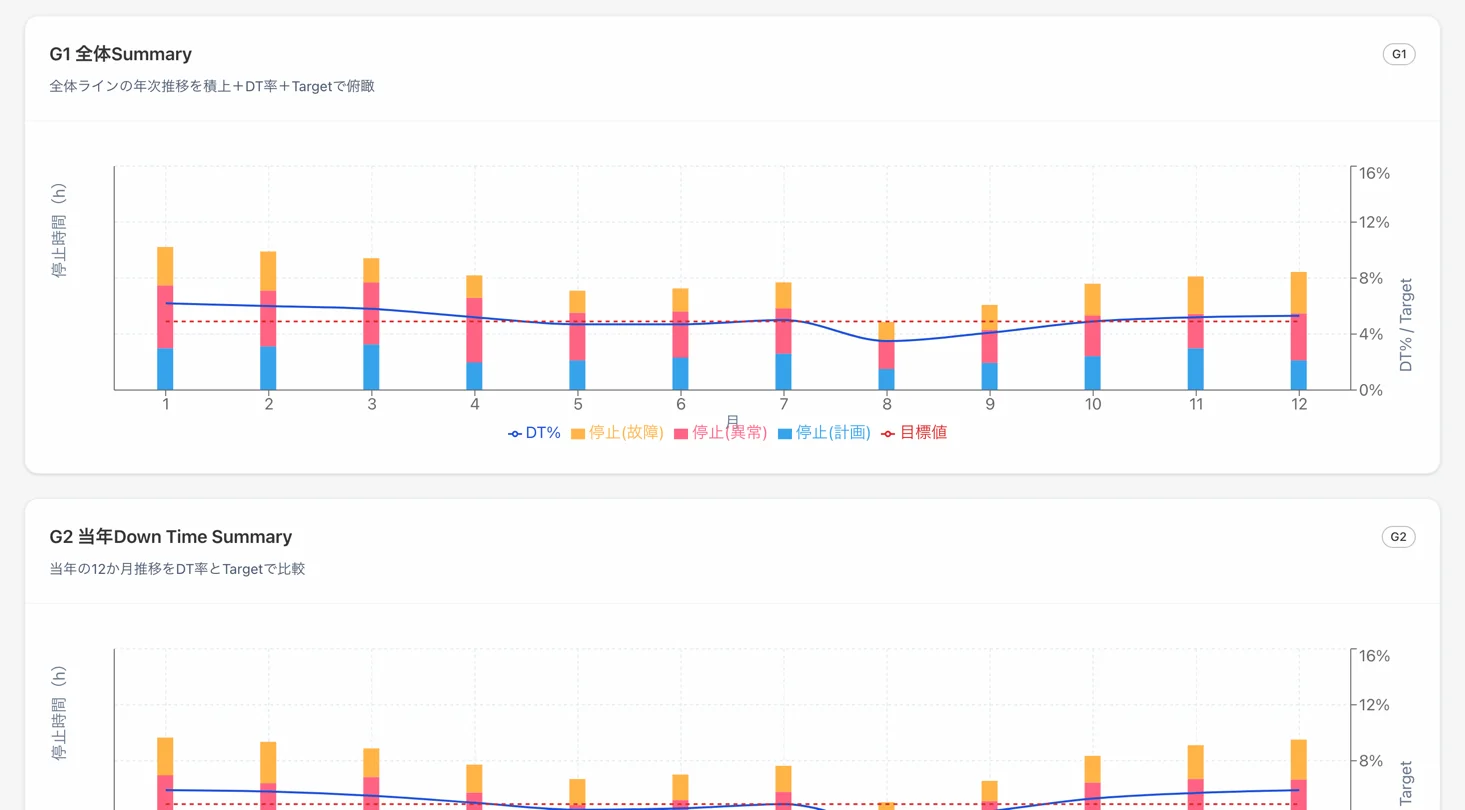
Analyze downtime trends with six charts
The overall Summary and current-year Down Time Summary visualize annual and 12-month downtime trends. Compare six charts across assembly, molding, and equipment or phenomenon categories, with views responding to filter conditions.
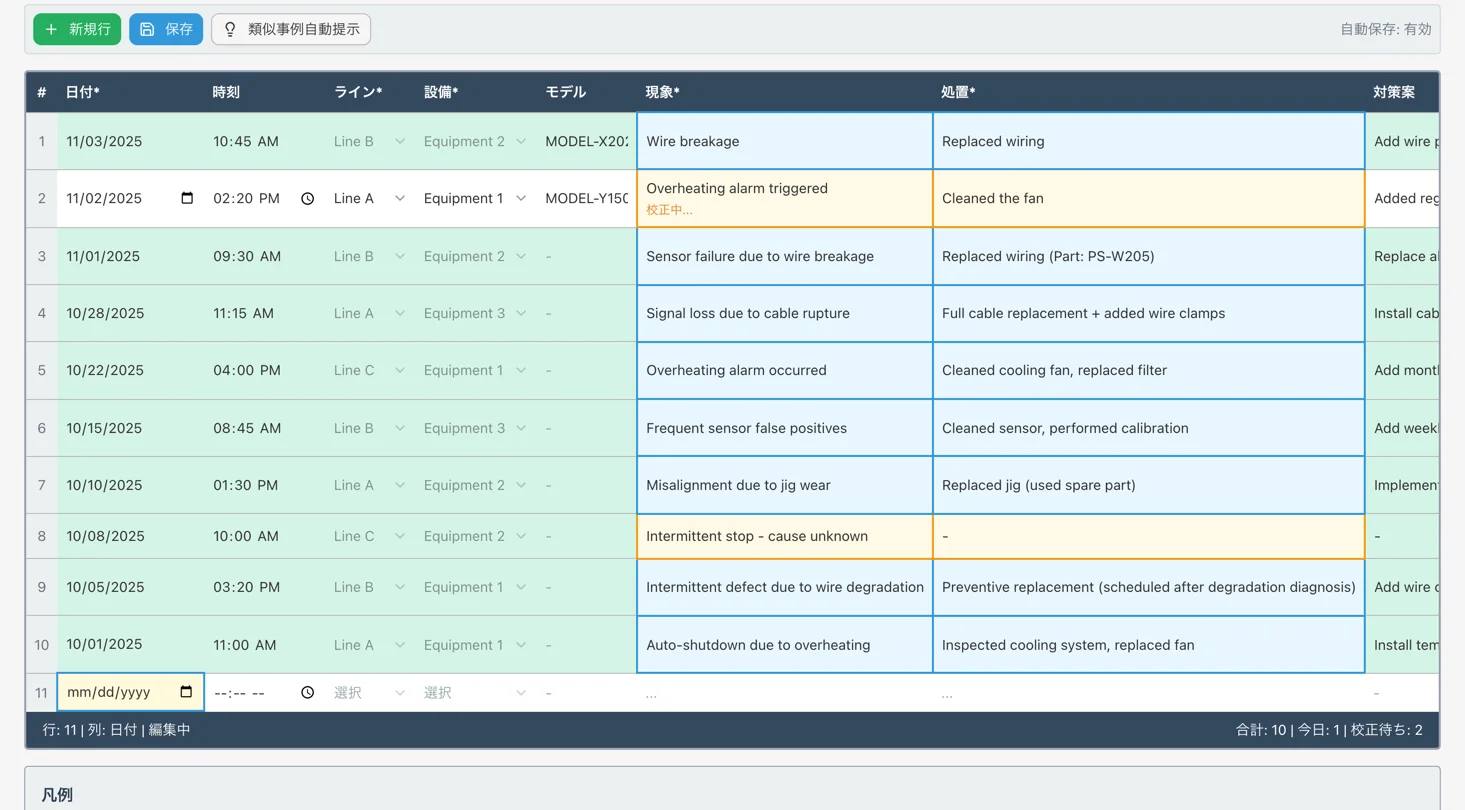
Spreadsheet-style failure-record entry
Enter and review dates, lines, equipment, failure modes, countermeasures, downtime, and assignees in a table. Distinguish PLC-captured events from manual entry, while showing LLM proofreading status and normalized tags in the same list.
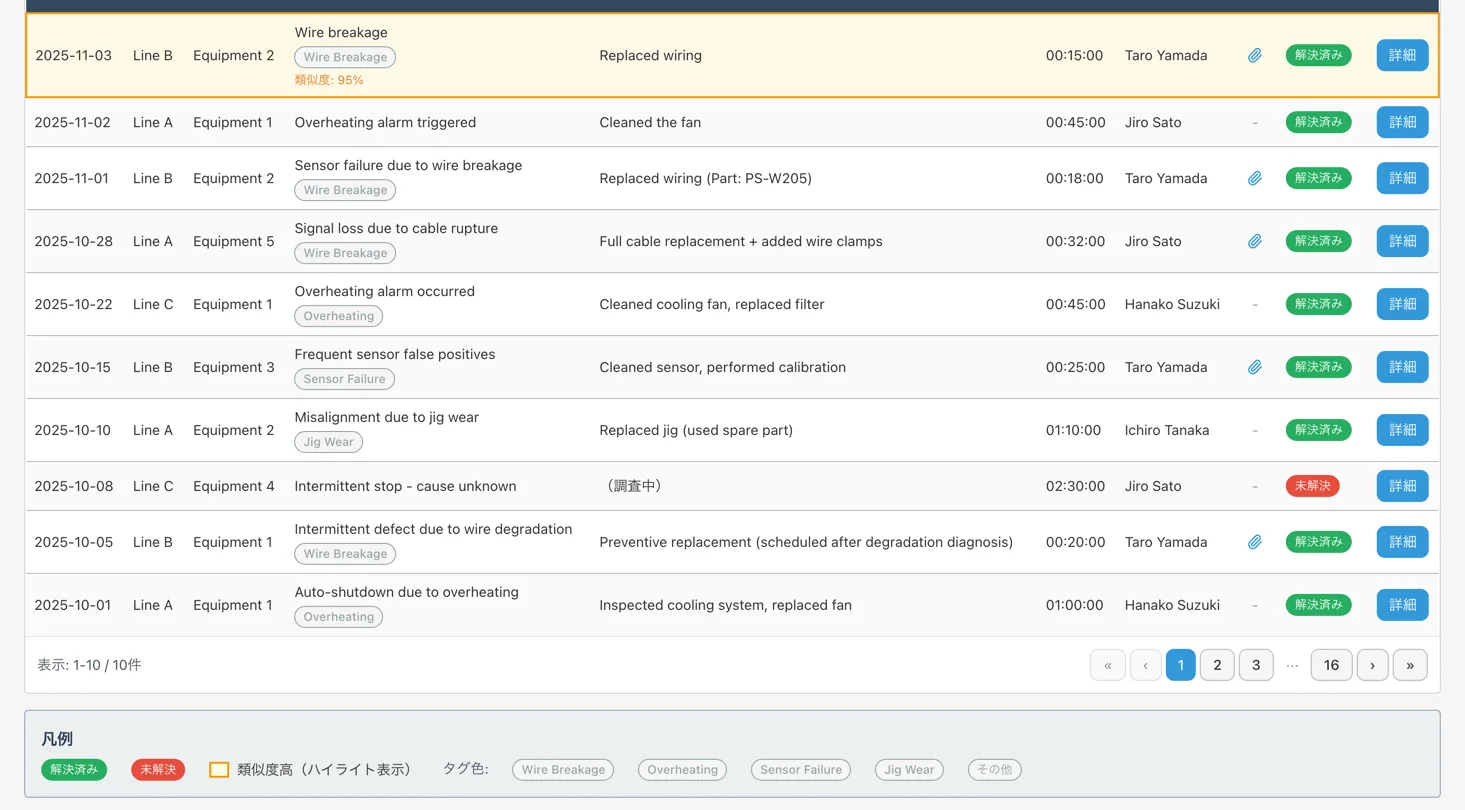
Search similar past cases and countermeasures
Filter past cases by keywords such as failure mode, countermeasure, and equipment, along with period, line, equipment, status, assignee, and normalized tag. Sort by date, similarity, or downtime to compare failure modes, countermeasures, and recovery time.
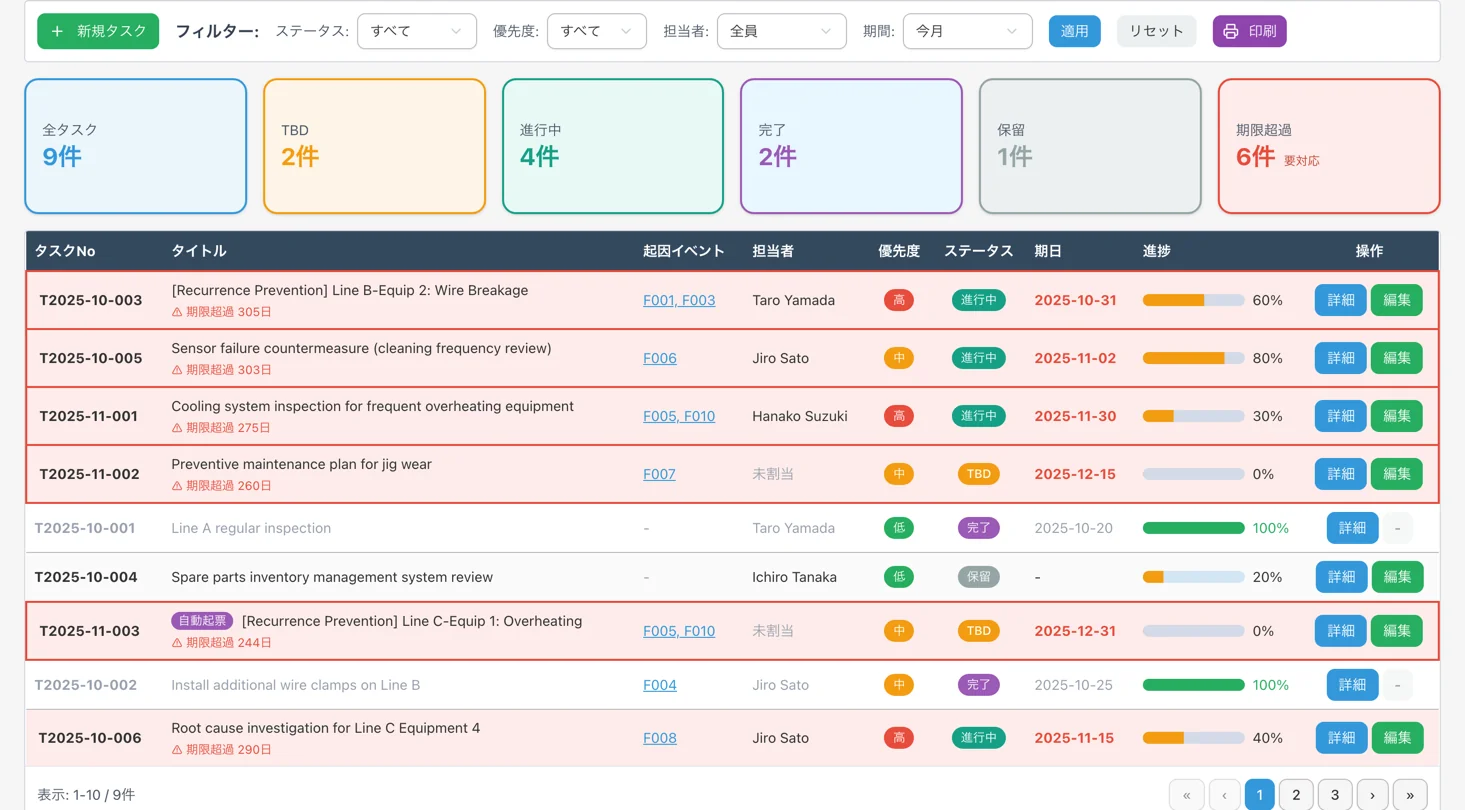
Manage improvement-task progress and deadlines
Track improvement tasks by triggering event, assignee, priority, status, due date, and progress. Warn about overdue work and create a task automatically when the same equipment and failure mode recur.
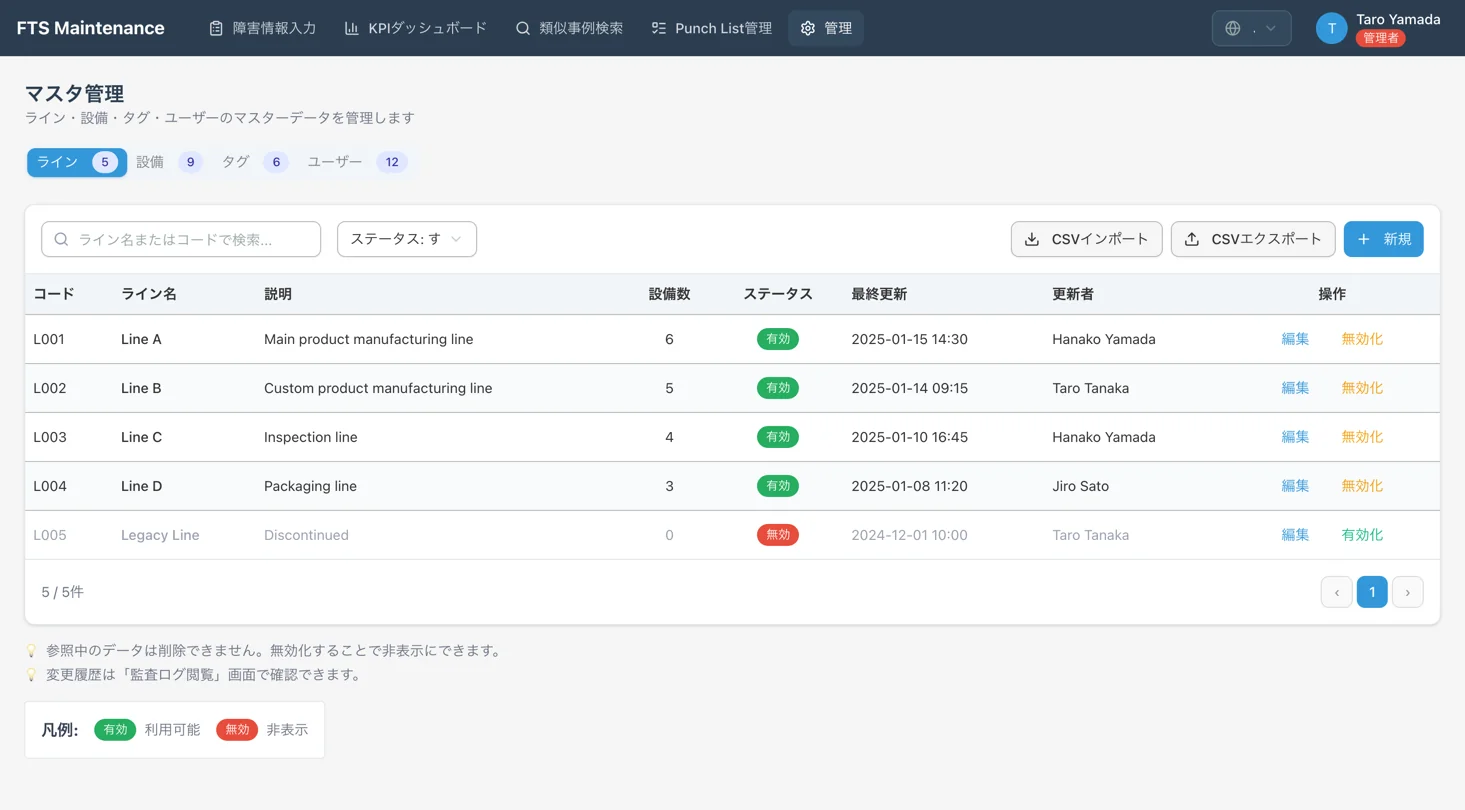
Manage maintenance master data in one place
Switch between line, equipment, tag, and user masters in tabs. Search, review status, add, edit, and deactivate records, with CSV import and export for line information.
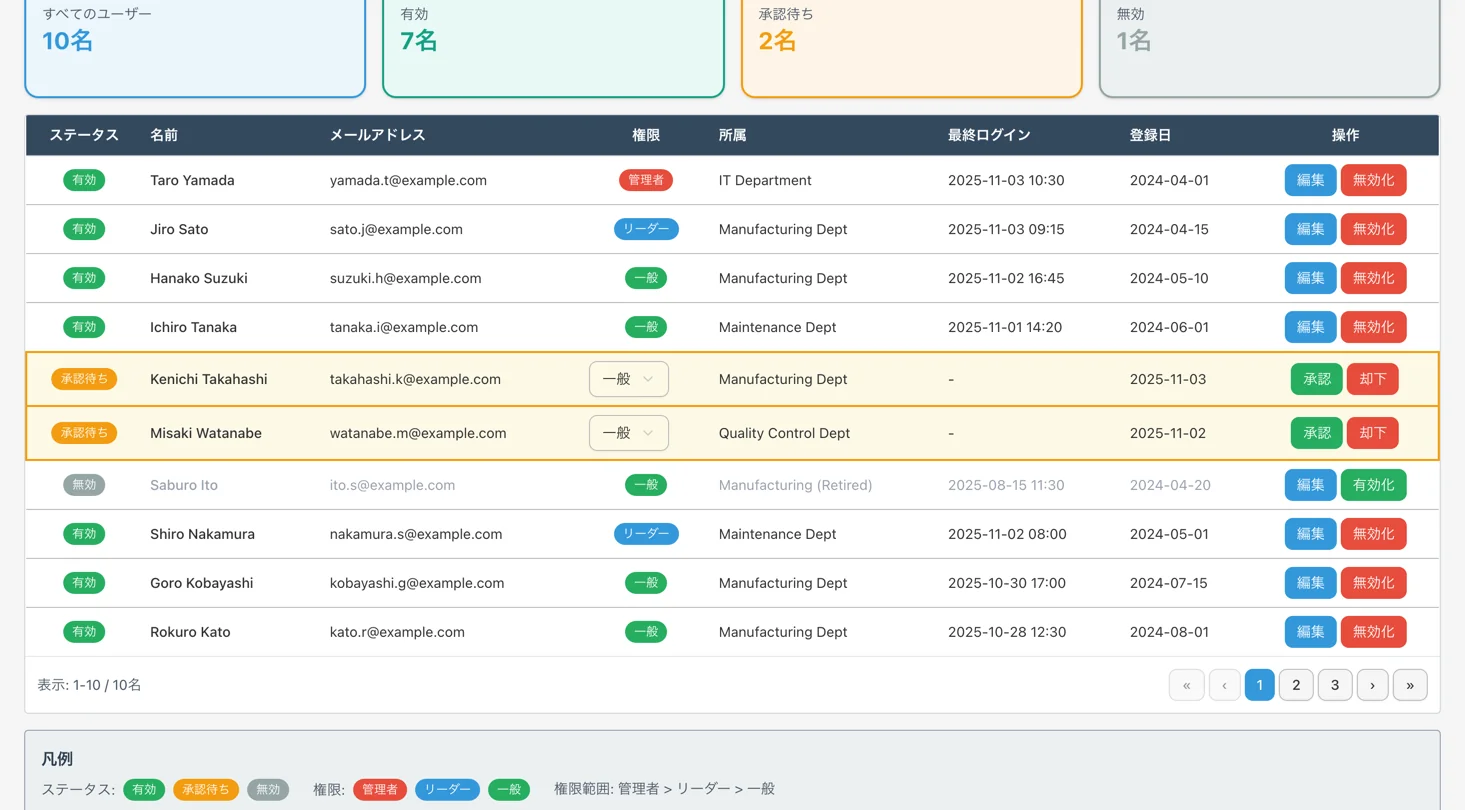
Manage user access and status
Administrators can review user access and status, then create, approve, reject, activate, or deactivate users. Three roles, administrator, leader, and general user, can be assigned; pending users receive a role at registration.
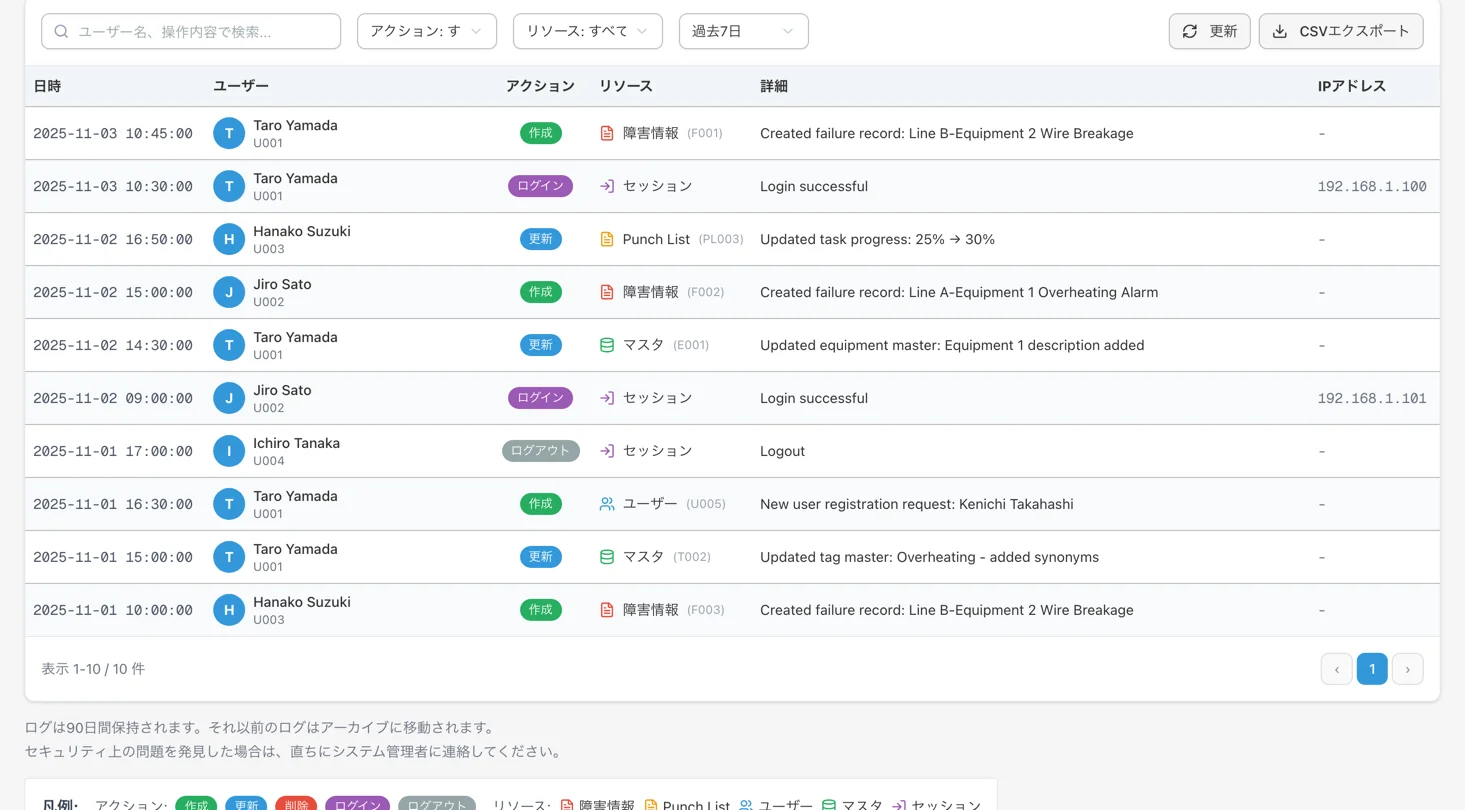
Track system actions in the audit log
Filter create, update, delete, login, and logout history by user, target resource, and period. Review date, user, action, target, and IP address in one list, with CSV export.
See five maintenance KPIs on one screen
Display stoppage count, total downtime, mean time to repair, recurrence rate, and equipment utilization as metric cards. Switch line groups, fiscal year, shift, and phenomenon category to review KPIs for the desired scope.
Analyze downtime trends with six charts
The overall Summary and current-year Down Time Summary visualize annual and 12-month downtime trends. Compare six charts across assembly, molding, and equipment or phenomenon categories, with views responding to filter conditions.
Spreadsheet-style failure-record entry
Enter and review dates, lines, equipment, failure modes, countermeasures, downtime, and assignees in a table. Distinguish PLC-captured events from manual entry, while showing LLM proofreading status and normalized tags in the same list.
Search similar past cases and countermeasures
Filter past cases by keywords such as failure mode, countermeasure, and equipment, along with period, line, equipment, status, assignee, and normalized tag. Sort by date, similarity, or downtime to compare failure modes, countermeasures, and recovery time.
Manage improvement-task progress and deadlines
Track improvement tasks by triggering event, assignee, priority, status, due date, and progress. Warn about overdue work and create a task automatically when the same equipment and failure mode recur.
Manage maintenance master data in one place
Switch between line, equipment, tag, and user masters in tabs. Search, review status, add, edit, and deactivate records, with CSV import and export for line information.
Manage user access and status
Administrators can review user access and status, then create, approve, reject, activate, or deactivate users. Three roles, administrator, leader, and general user, can be assigned; pending users receive a role at registration.
Track system actions in the audit log
Filter create, update, delete, login, and logout history by user, target resource, and period. Review date, user, action, target, and IP address in one list, with CSV export.
Project Overview
Technology Stack (11 technologies)
- Next.js 15 (App Router) + OpenNext
- React 19 + TypeScript
- Tailwind CSS 4 + shadcn/ui + Radix UI
- next-intl (Japanese and English switching)
- React Hook Form + Zod
- TanStack React Table
- Recharts
- Cloudflare Workers + Convex
- Gemini 3 Flash (LLM proofreading and normalization)
- AWS IoT Core + Amazon Bedrock AgentCore + Amazon Cognito
- Amazon RDS (PostgreSQL 15 + pgvector)
Implemented Features (8 features)
- Failure entry, LLM proofreading, and automatic normalization
- Automatic suggestions and search for similar cases
- KPI dashboard (six charts)
- Automatic Punch List creation and progress tracking
- PLC stoppage event capture and downtime calculation
- Master data for lines, equipment, tags, and users
- User creation, approval, and access control
- Audit-log search and CSV export
We can build a similar system for your business.
Build a dedicated SaaS product with ¥0 initial cost in 2–6 weeks using the SDK and AI.